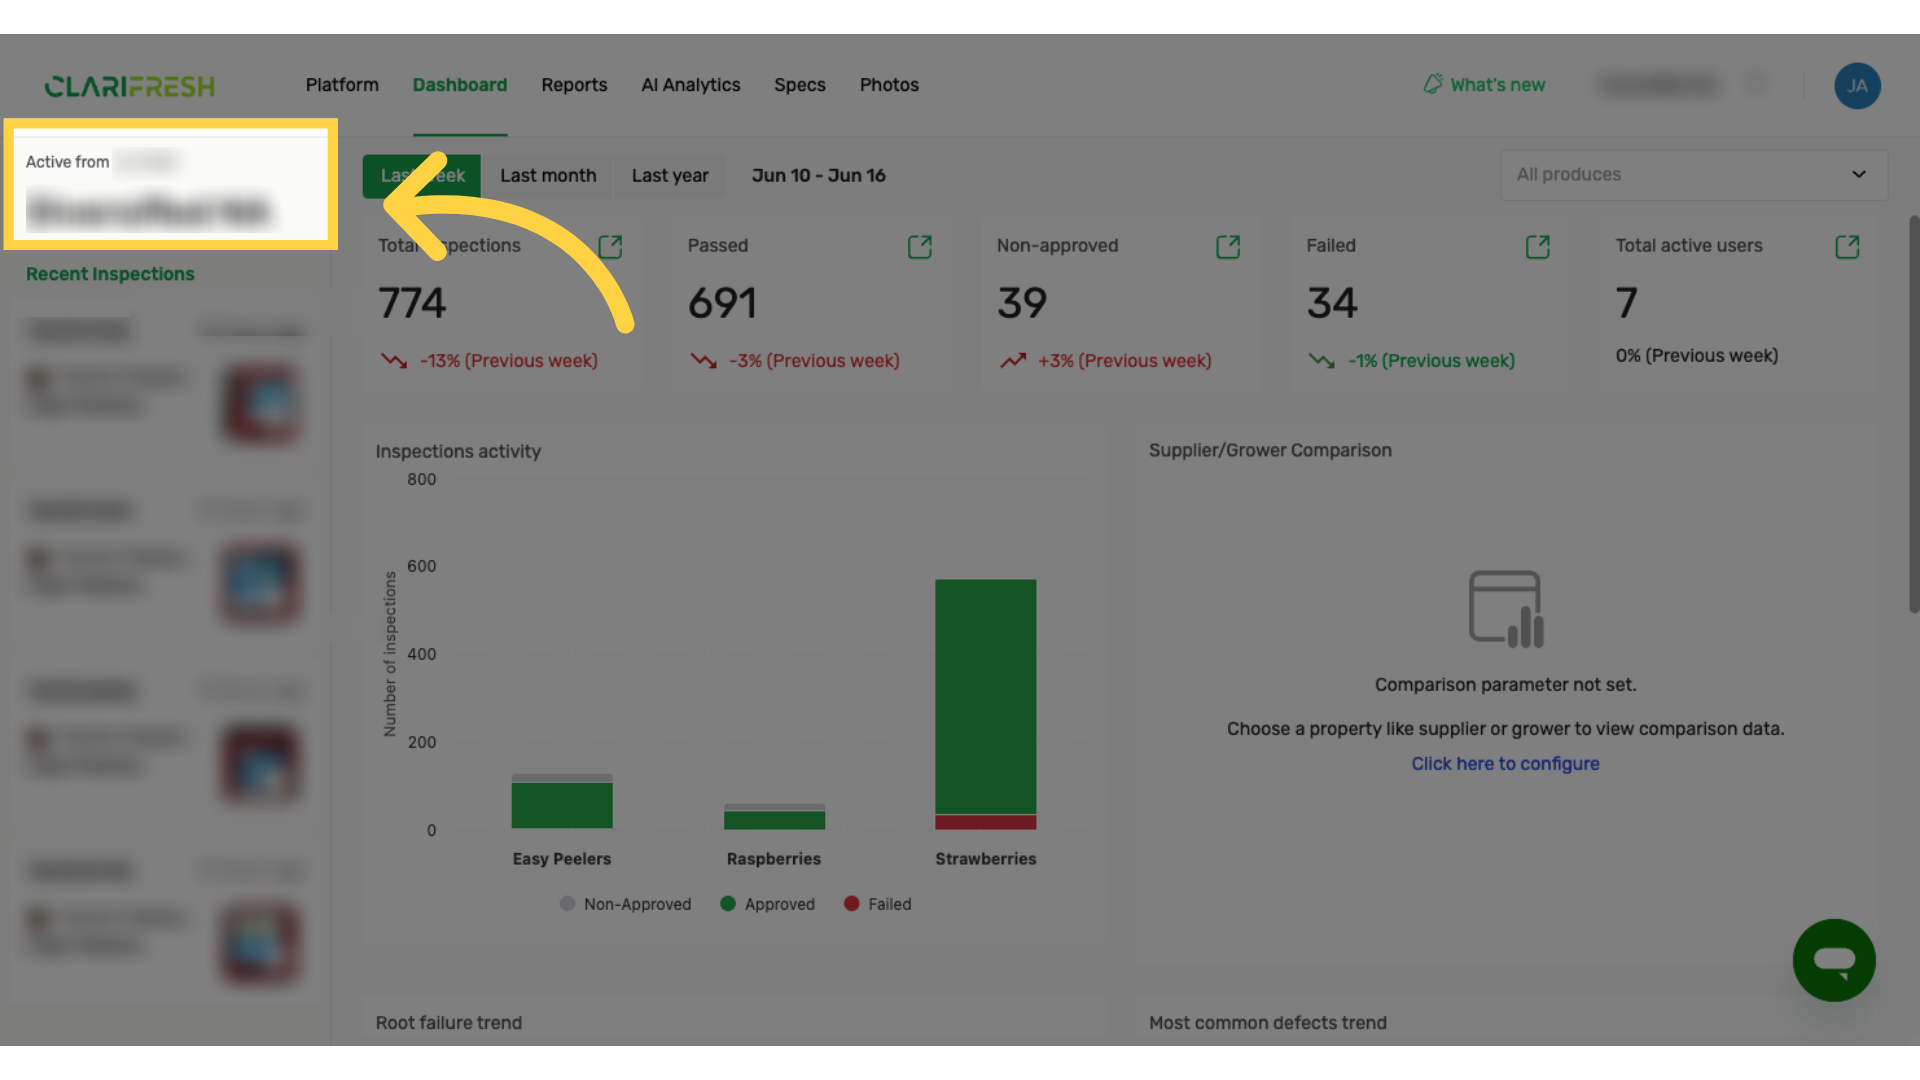
1. Account Name on the top left with Active from date
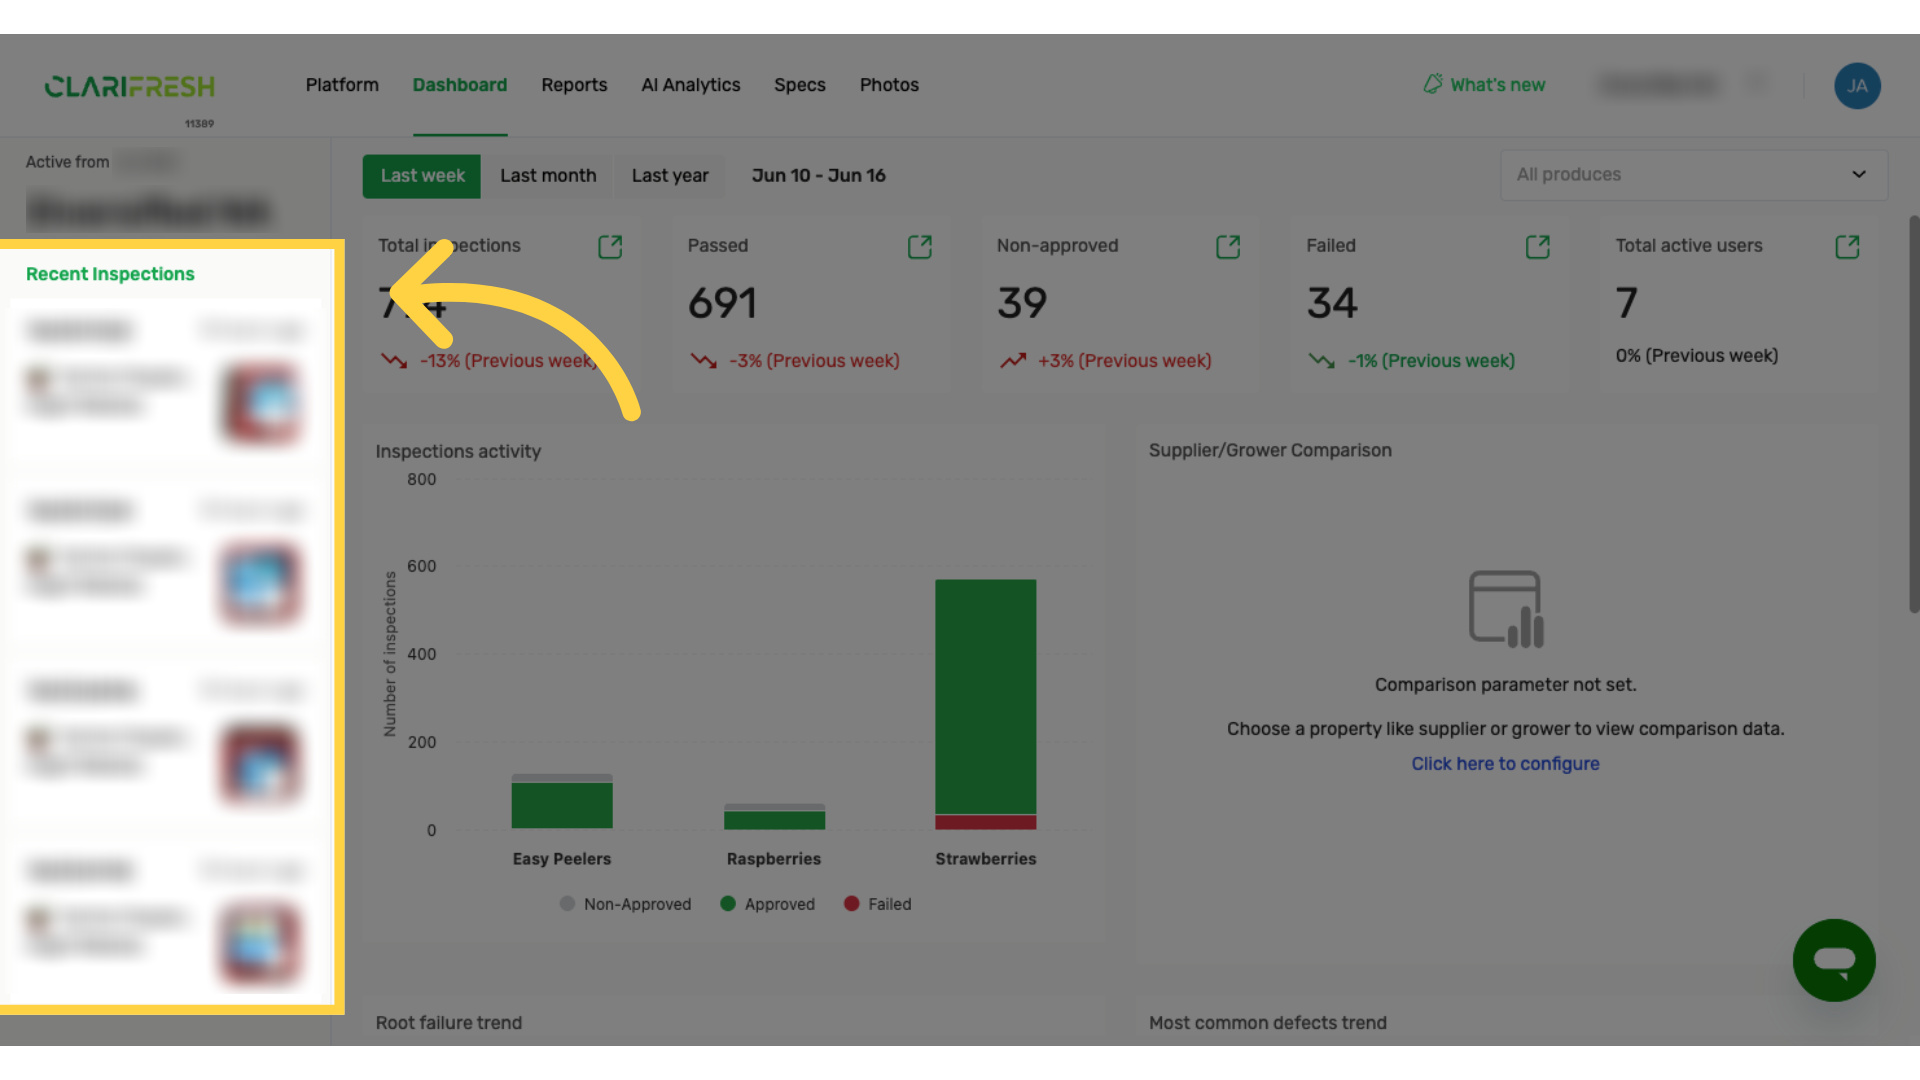
2. Recent Inspections on the left sidebar.
Click on Resent inspections will navigate to recent inspections in the reports screen.
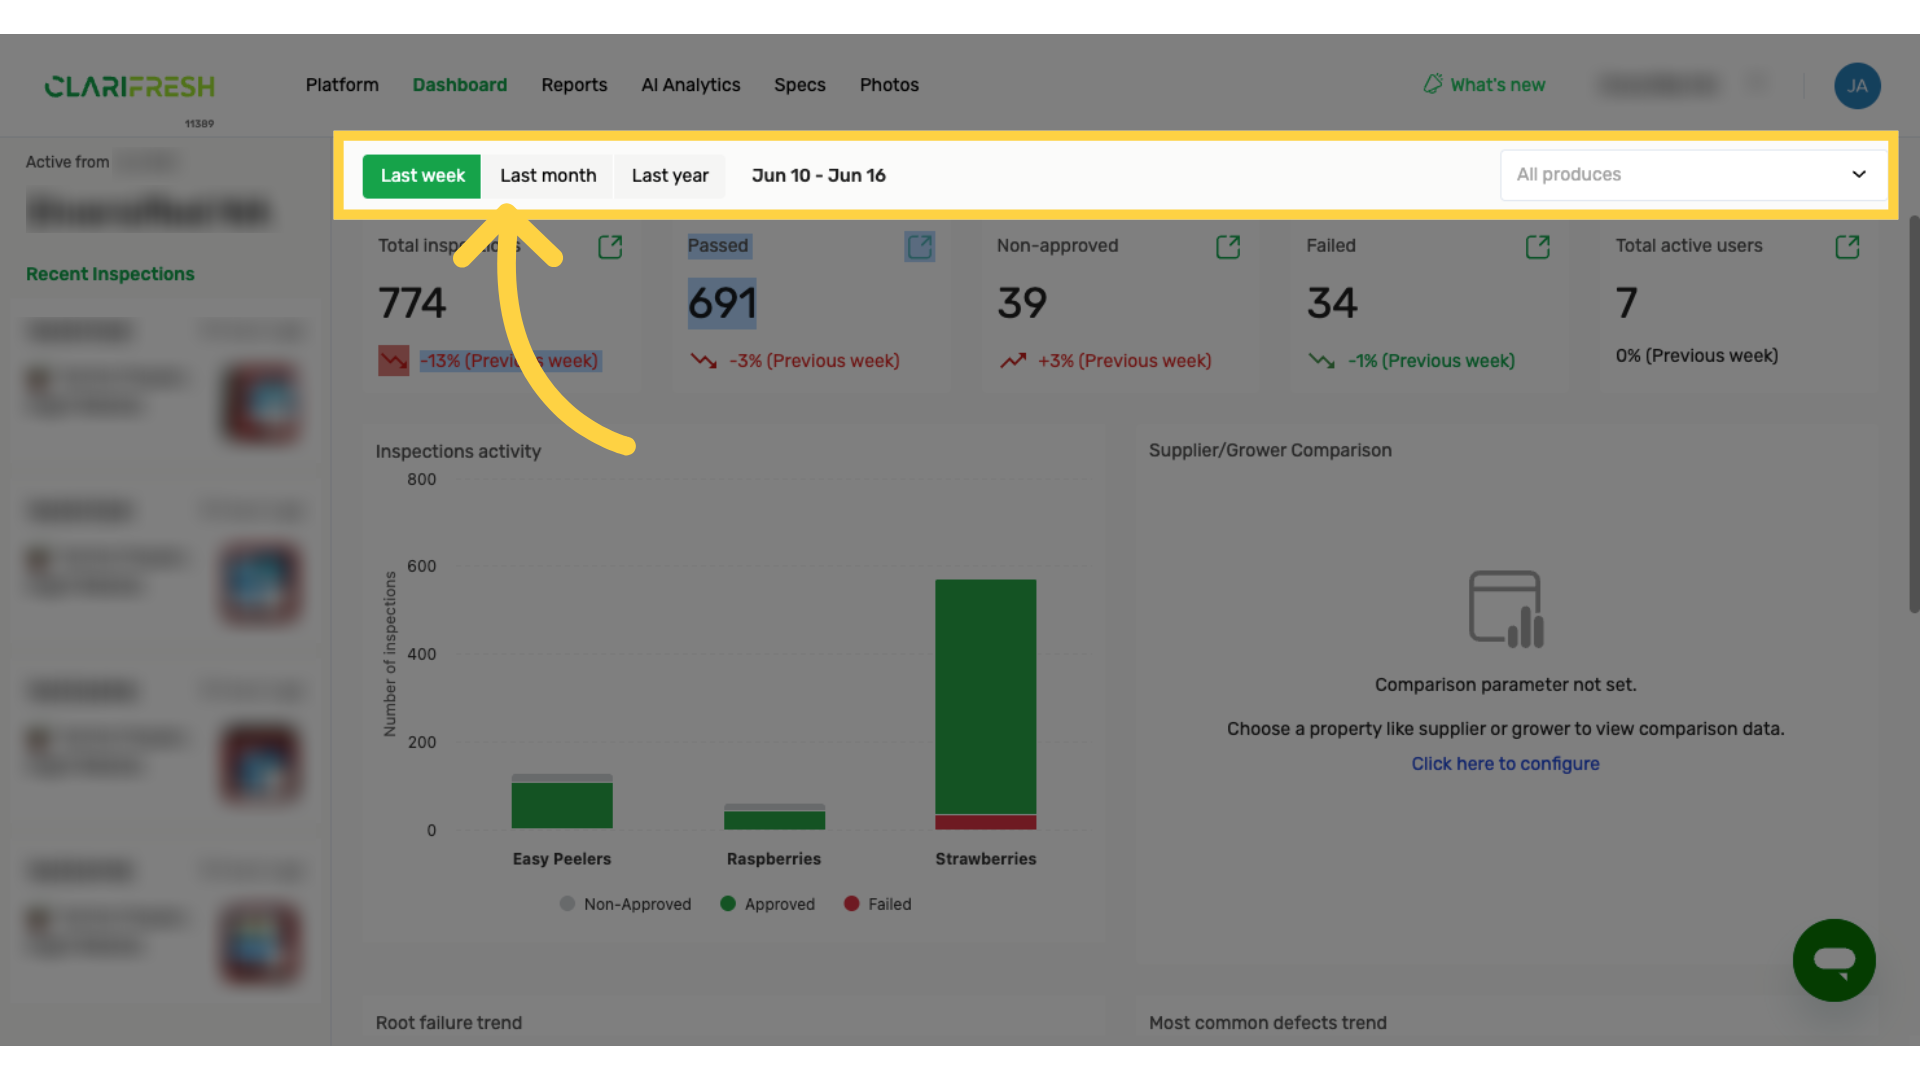
3. Dashboard filters for bottom charts data.
The first filter is by period: Last Week, Last month, Last year
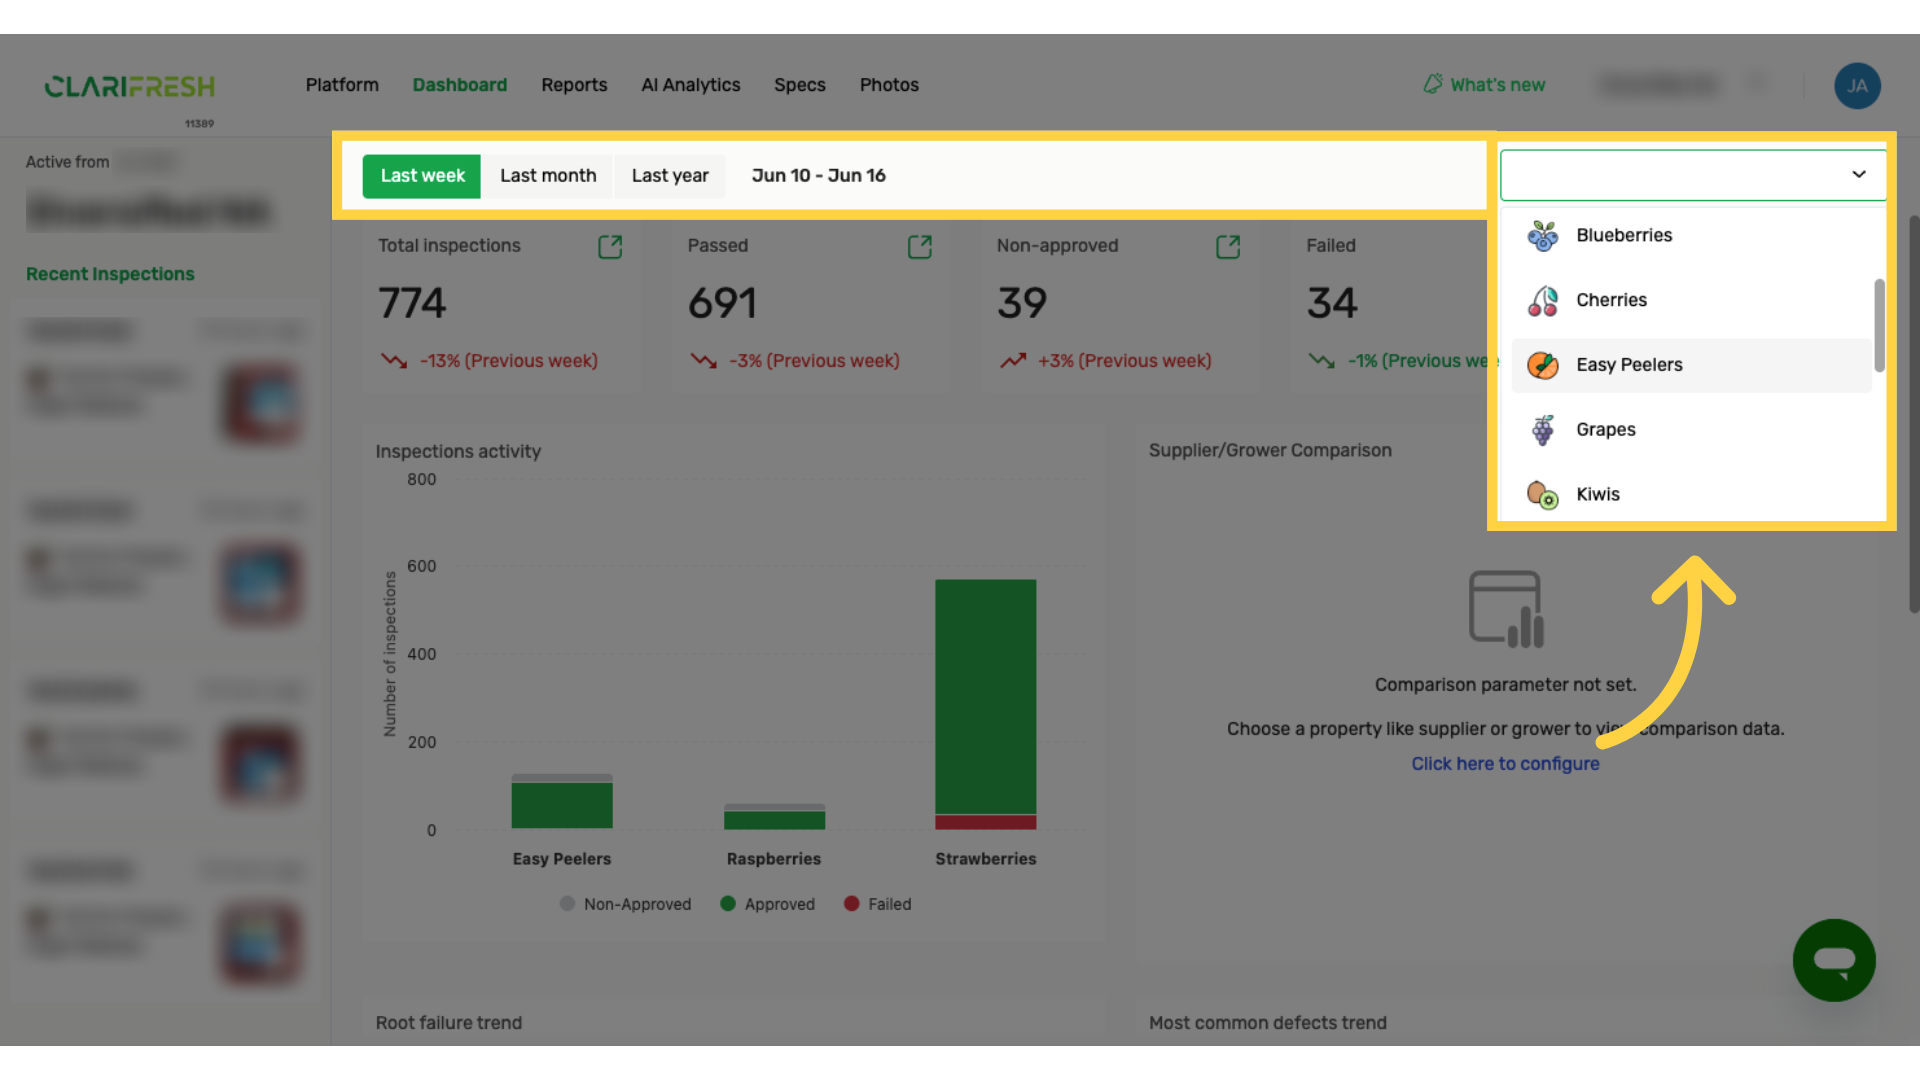
4. Also, filter by produce to focus the chart's data
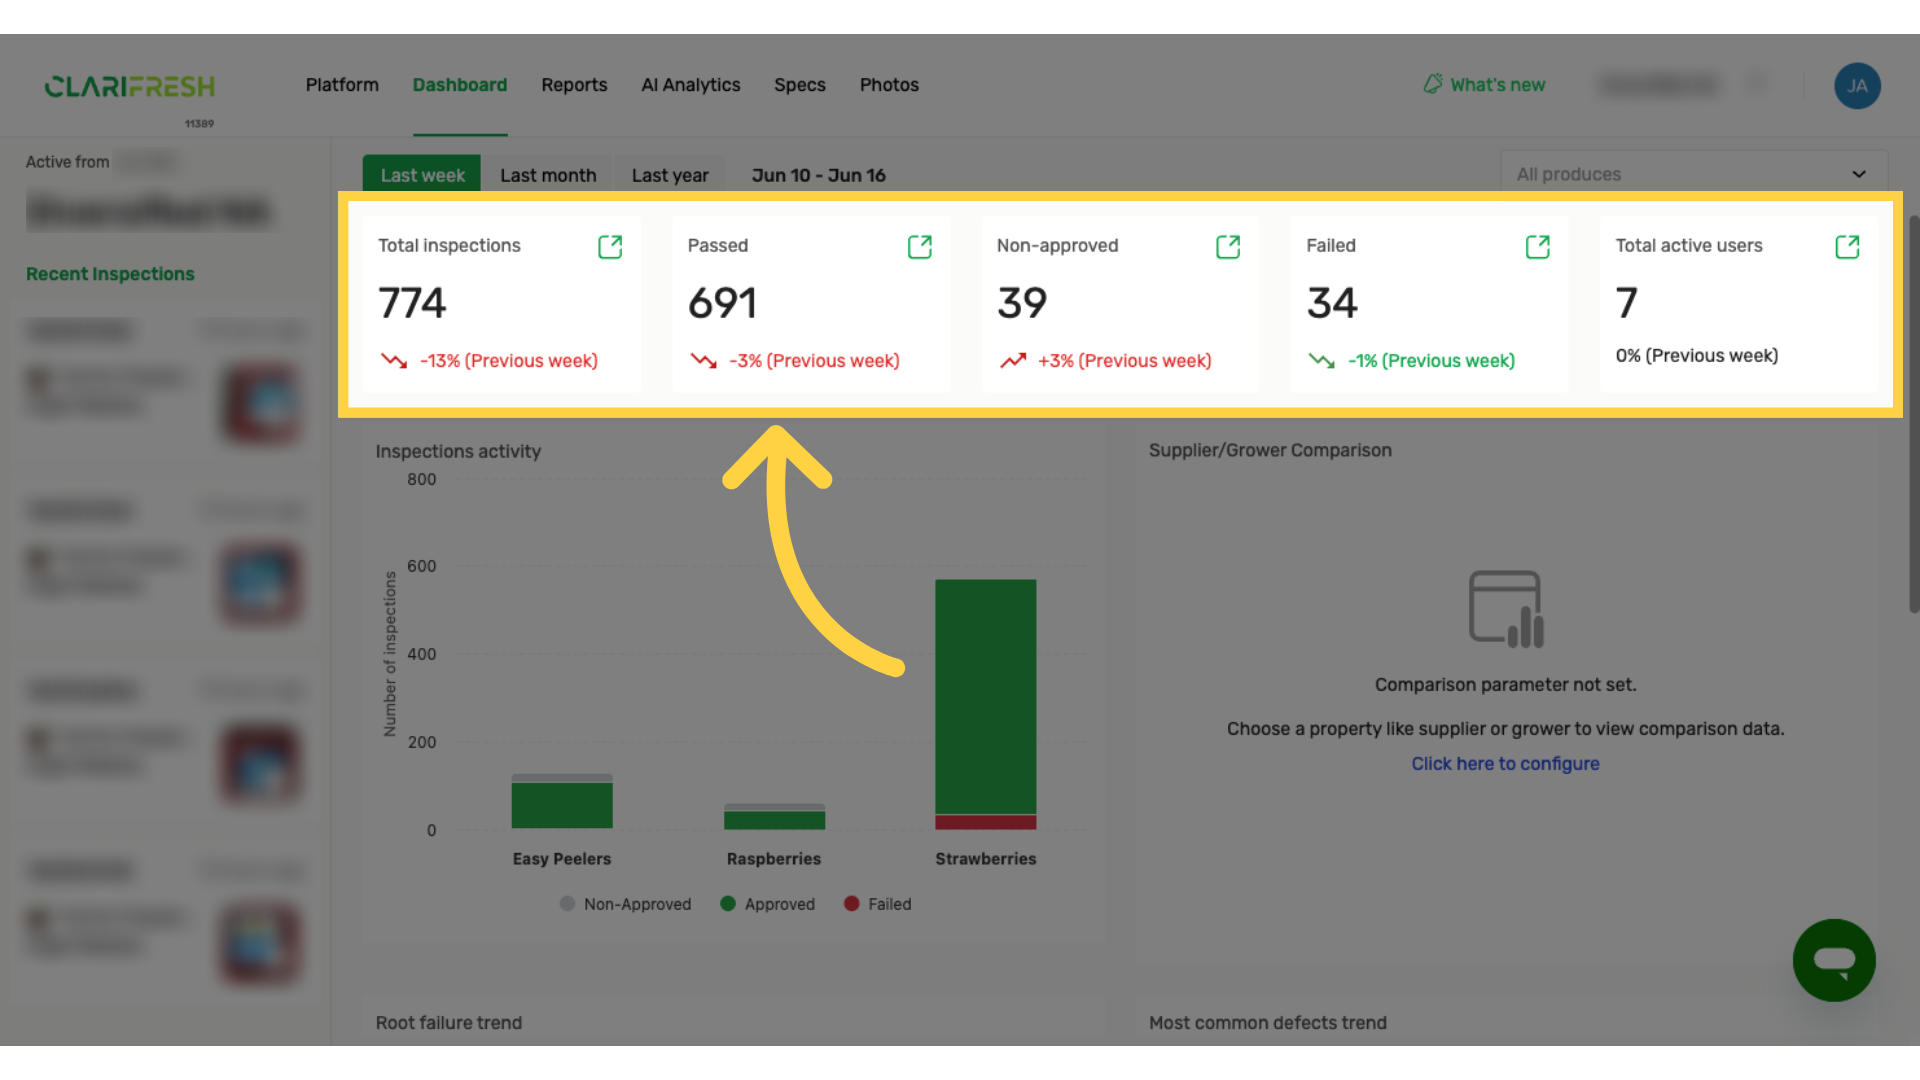
5. KPIs with a comparison to a previous period.
KPIs: Total Inspections, Non-Approved Inspections, Approved (Passed and Failed), and Total Active Users.
Each KPI card is clickable: inspection-related KPIs link to the Reports screen, while the Total Active Users card links to the Usage Report.
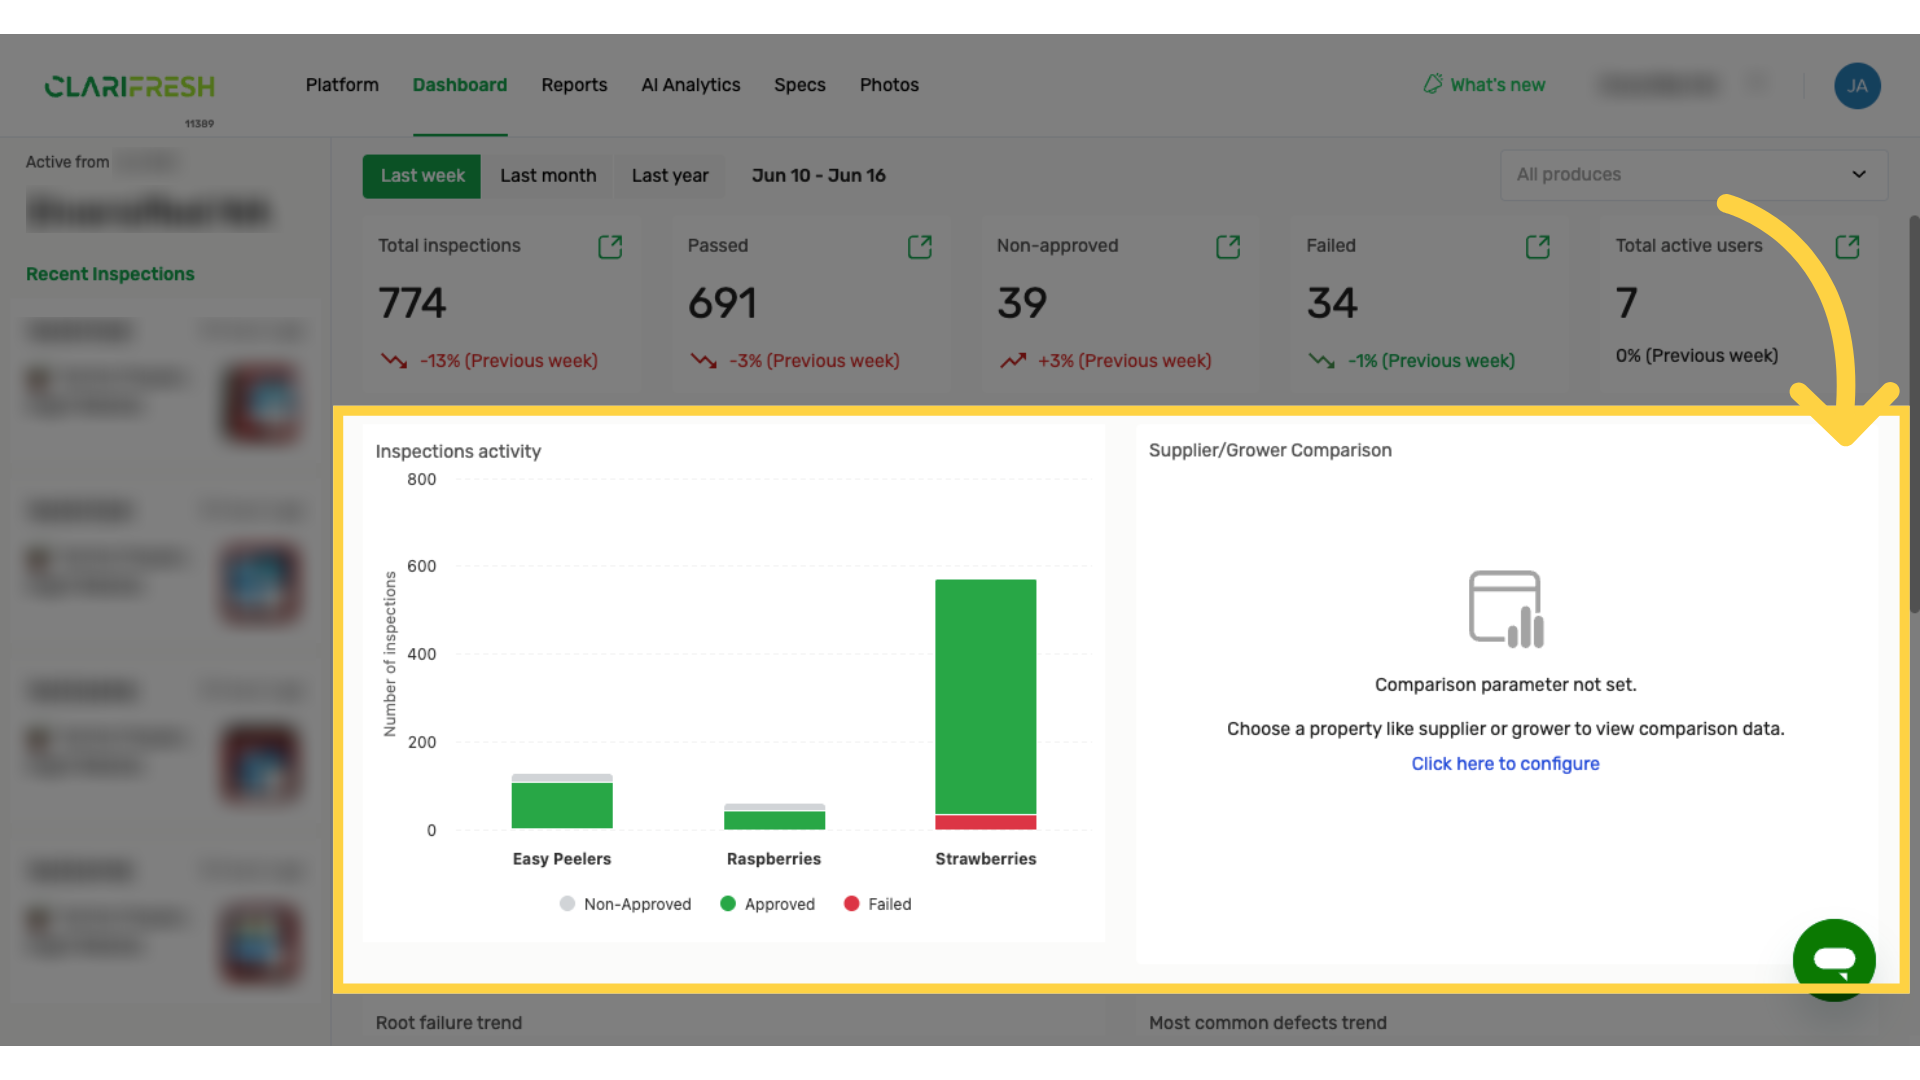
6. The first stacked bar chart, Inspection Activity, breaks down produce inspections by KPI categories
The Inspection Activity chart shows inspections per produce, segmented by KPI groups that combine status and grade:
-
Non-Approved
-
Approved & Passed
-
Approved & Failed
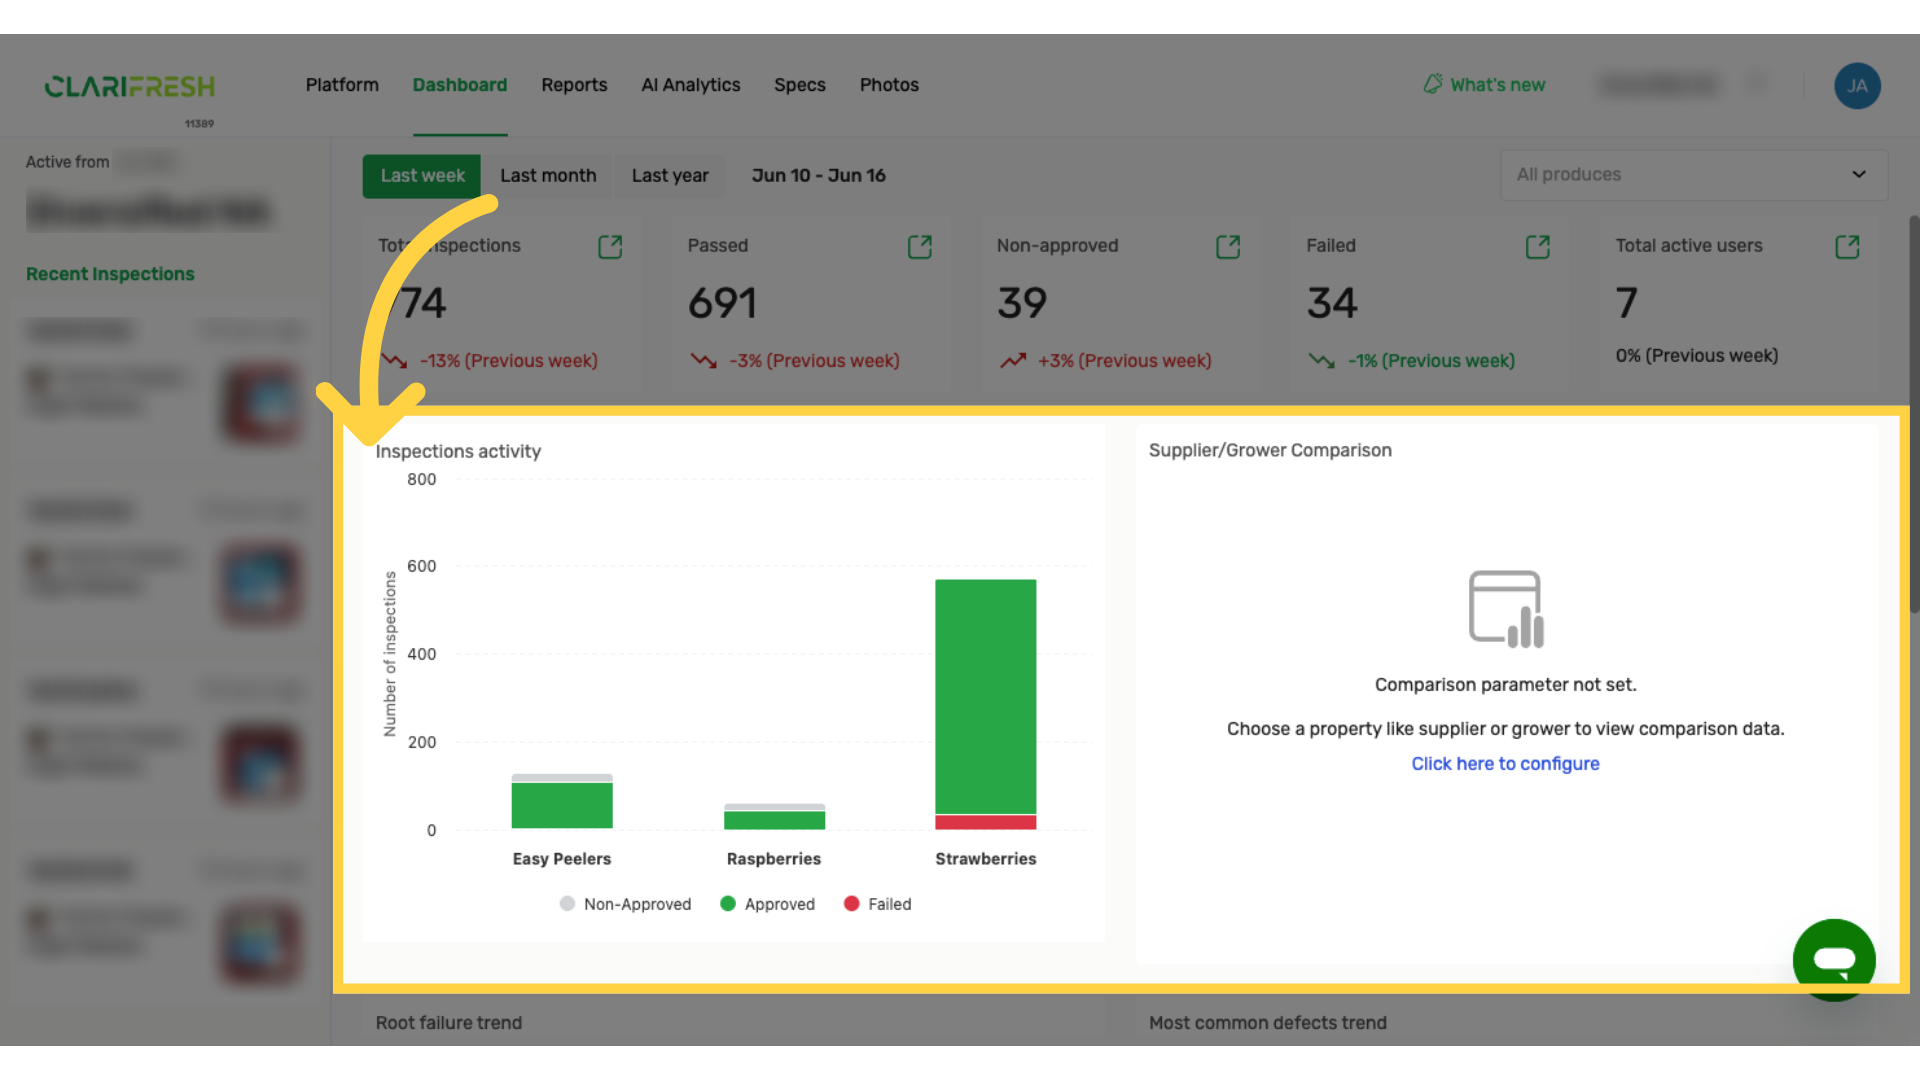
7. Grade comparison for Supplier/Grower.
The second stacked bar chart compares the performance of entities from the selected property—such as Supplier, Grower, or another custom-defined field.
This property is set in Company Settings > Company Specs, under the Supplier dropdown.
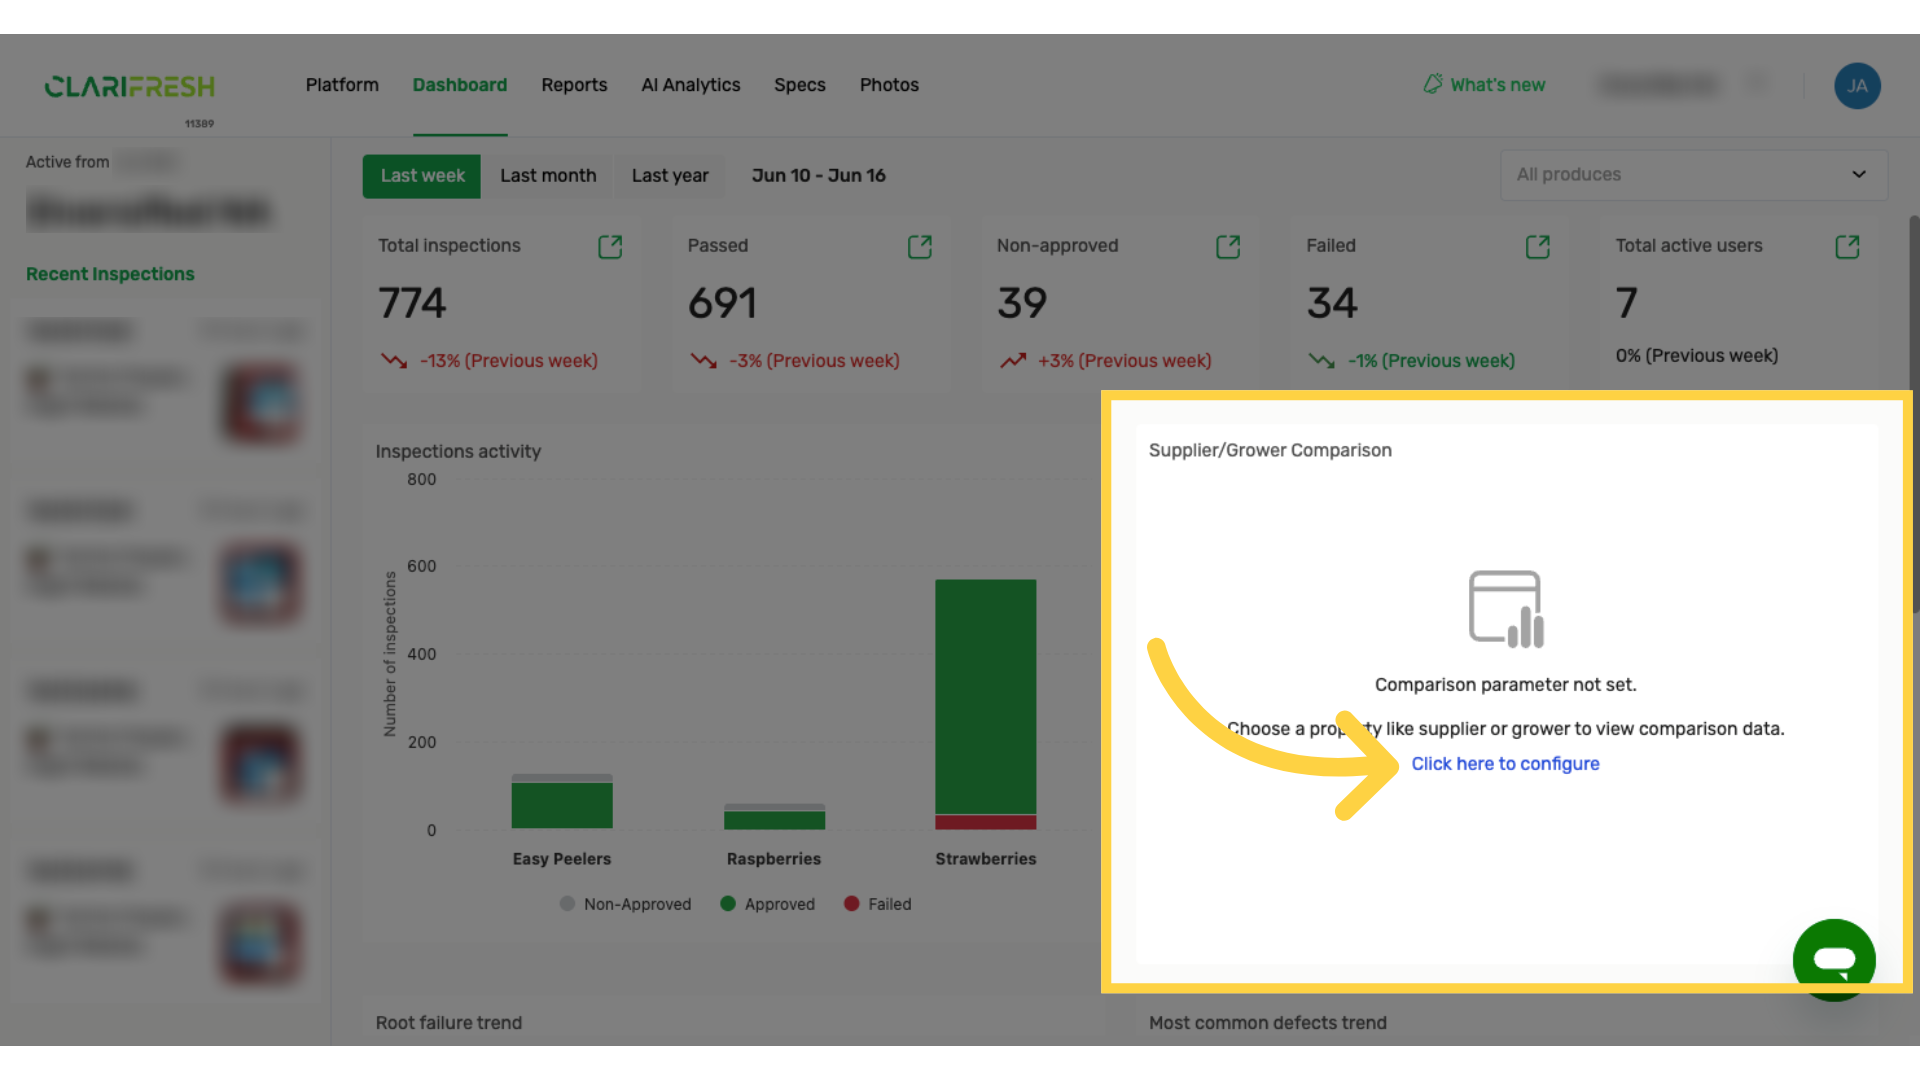
8. Click the link or Go to settings to select the property of your choice
A link labeled “Click here to configure” takes users to the settings page to select the comparison property:
-
The grouping property used for comparison is set in:
Company Settings > Supplier dropdown -
This dropdown allows users to define which property (e.g., Supplier, Grower) to use for the chart comparison.
-
After selection, the system takes 30–60 seconds to aggregate the required data.
-
Users must click Refresh when returning to the dashboard to update the Comparison stacked bar chart with the new data.
9. The third chart displays the trend of the top 5 causes of inspection failure over the selected period.
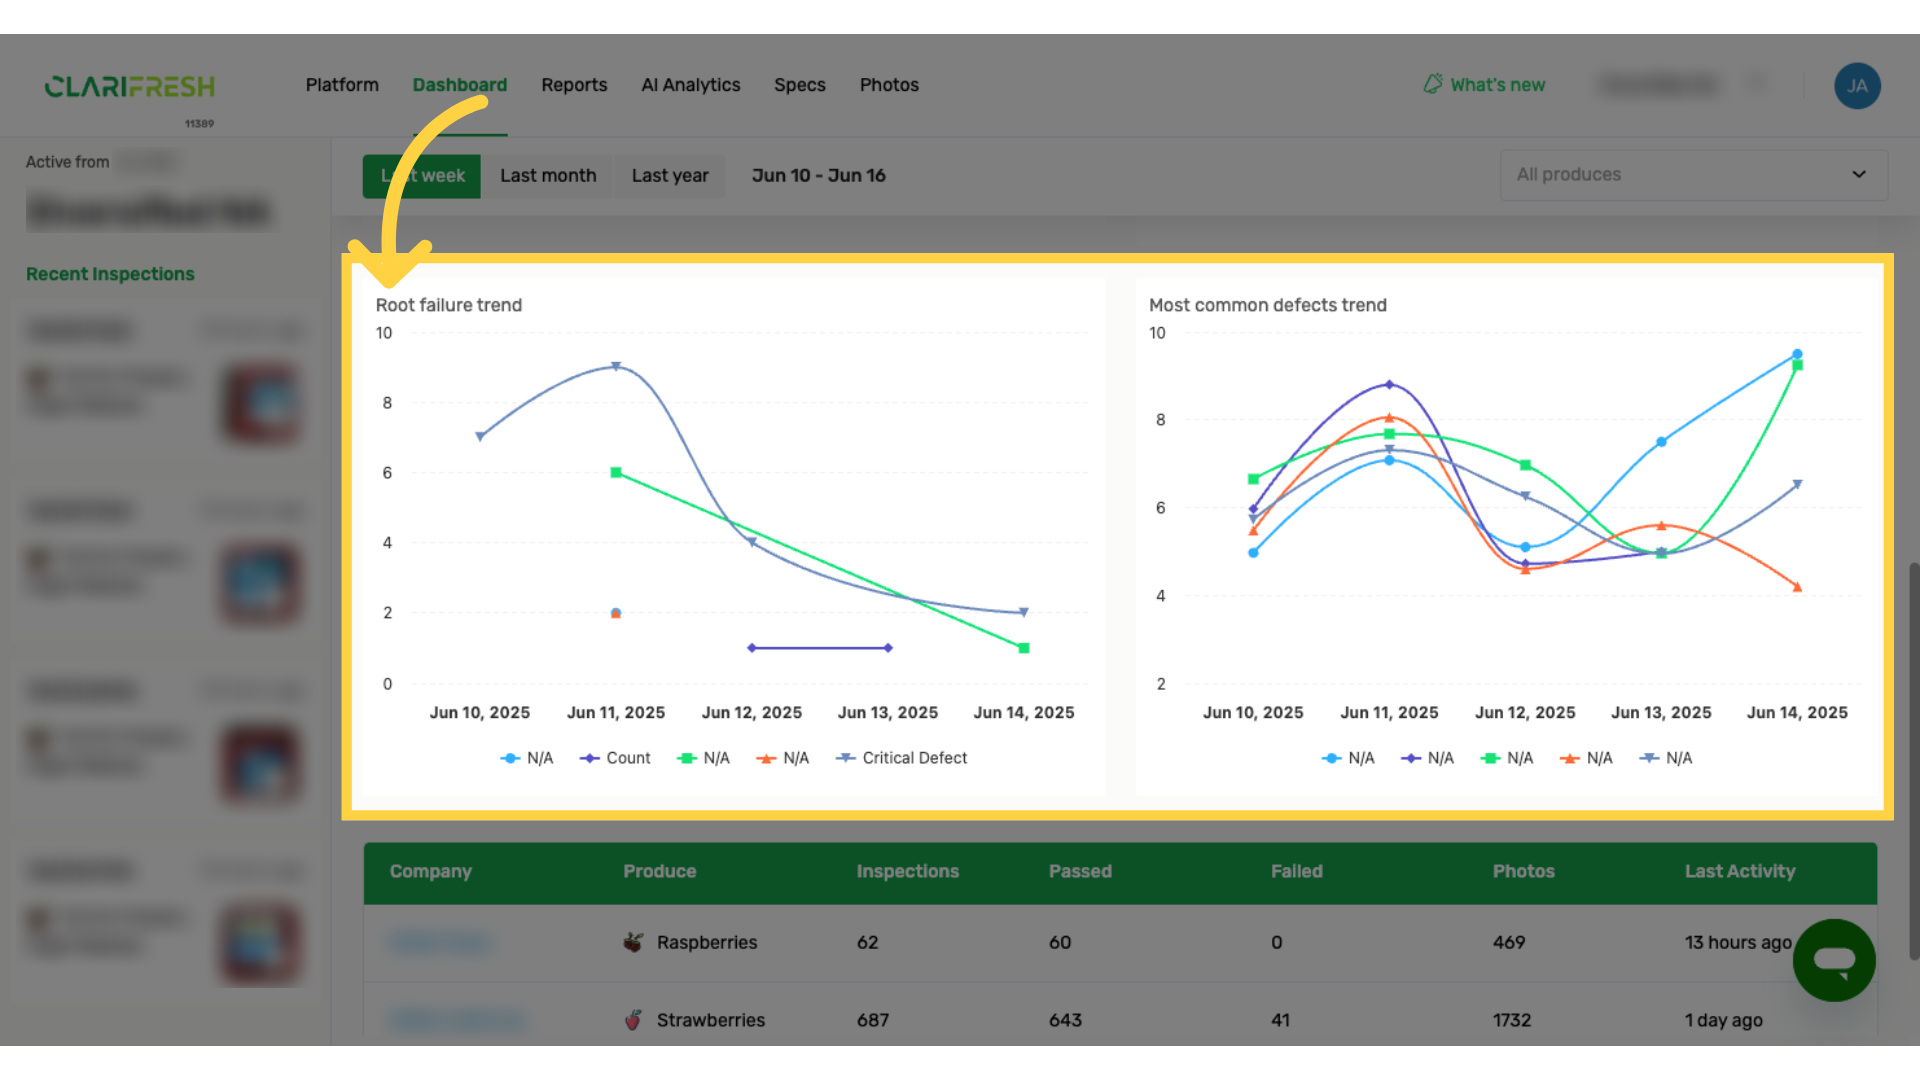
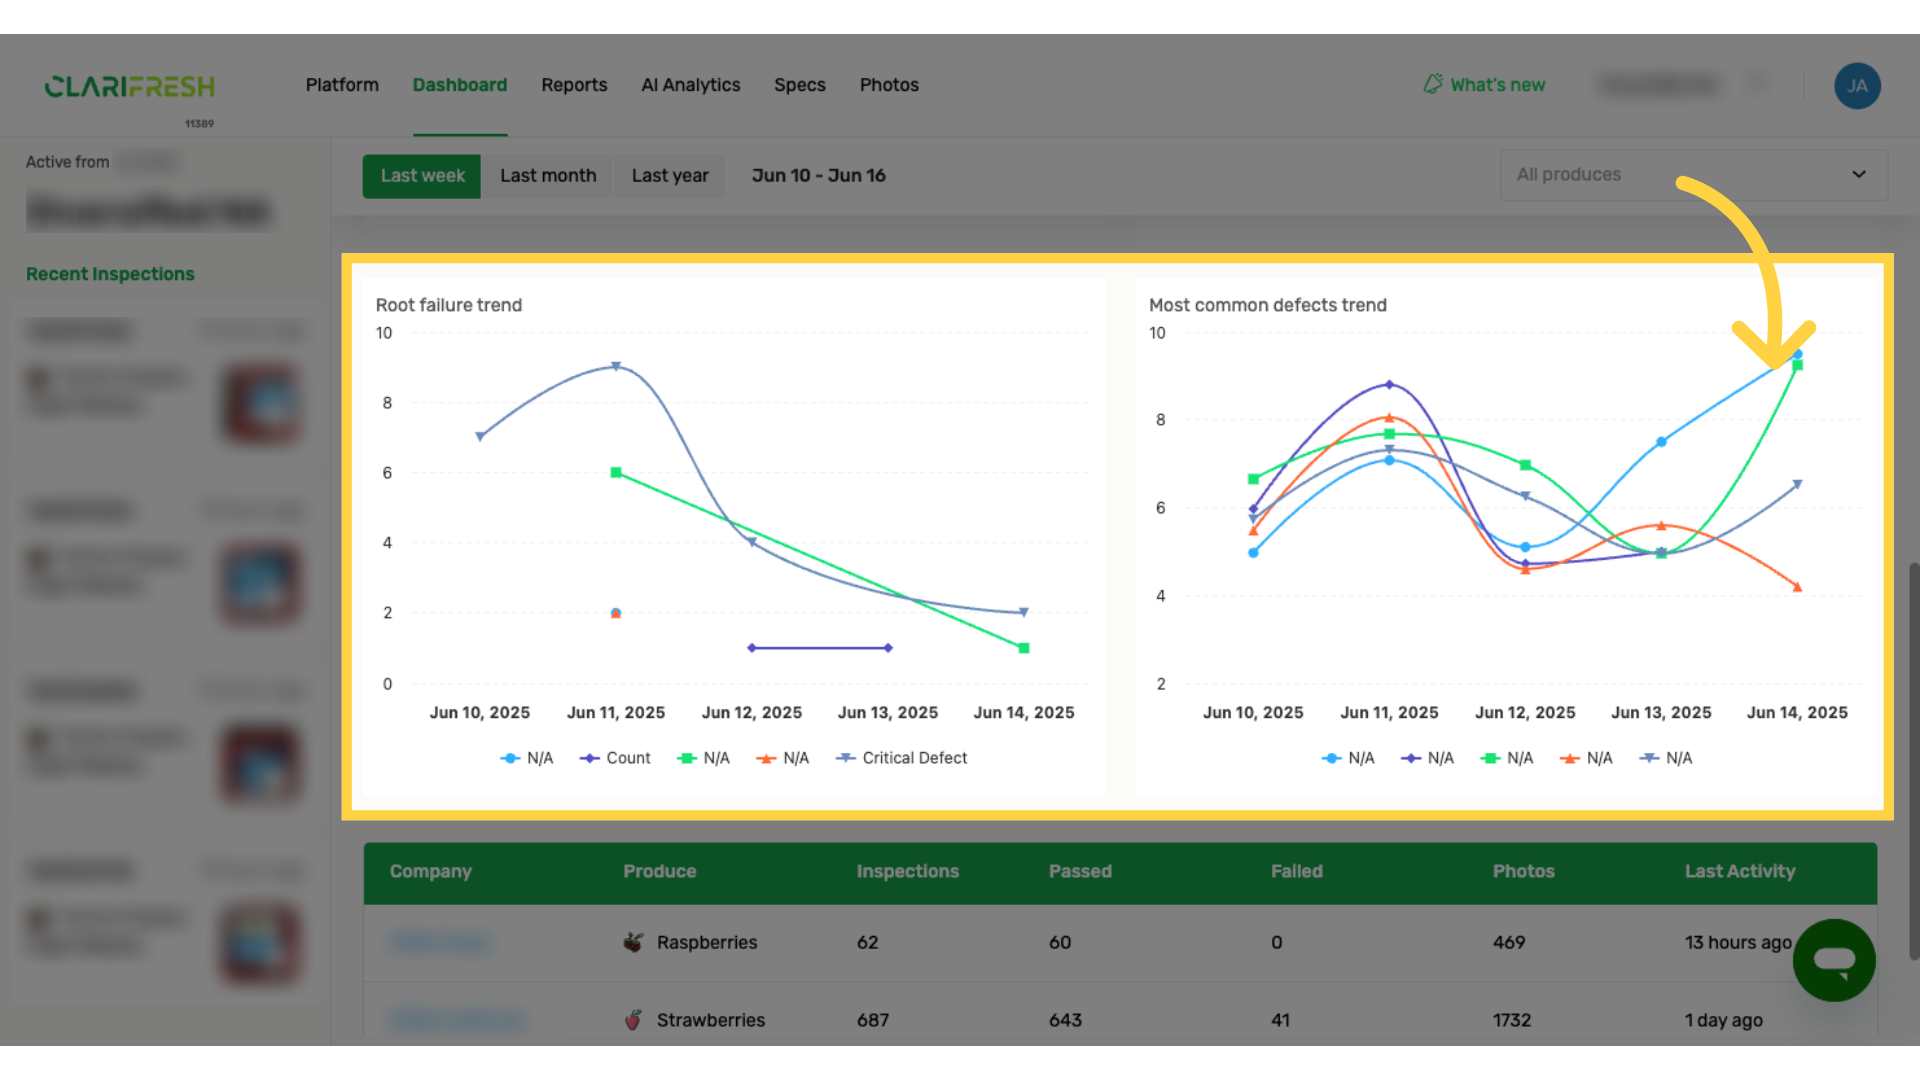
10. The fourth chart displays the trend of the top 5 most common defects over the selected period.
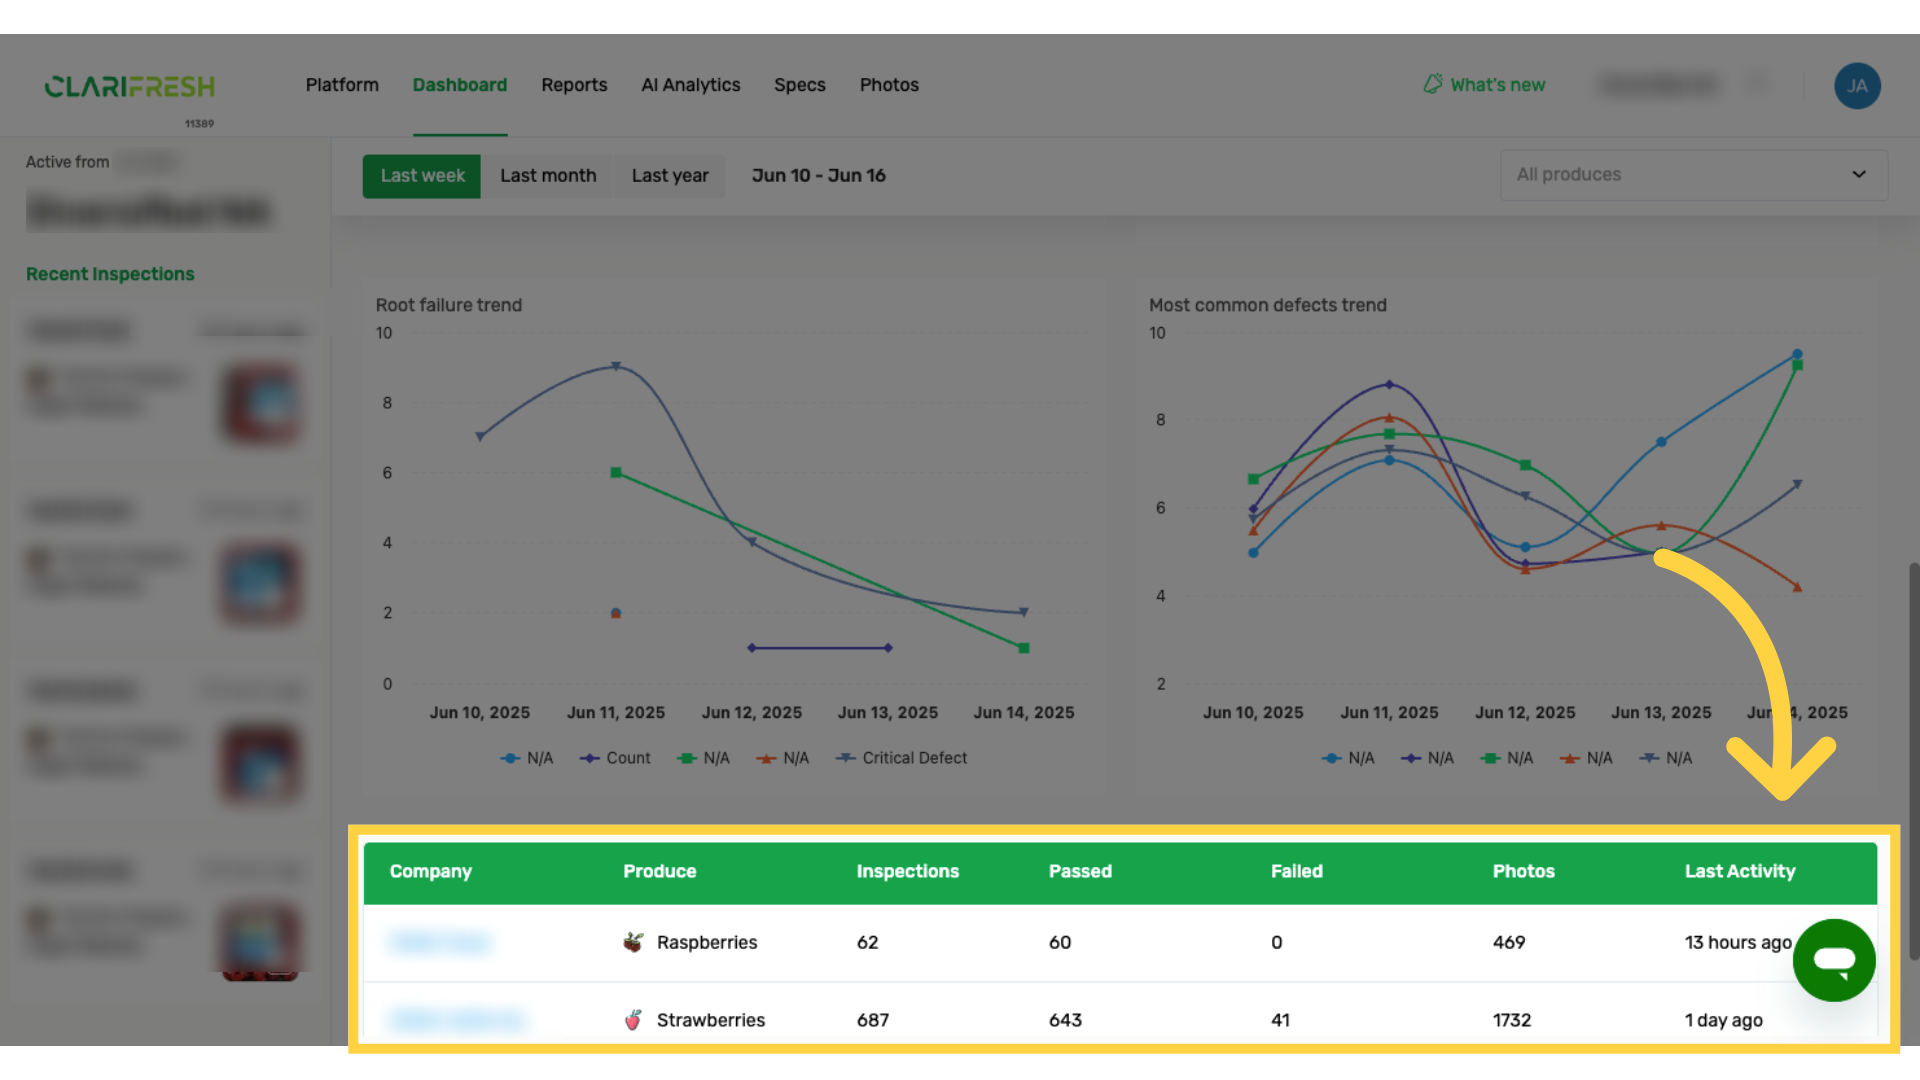
11. On the bottom, a summary table per sub-account and produce
Each row links to its corresponding report.
The new dashboard helps users quickly analyze inspection data, identify trends, and improve decision-making and quality assurance.